Synergy Heat Map
clip showing the Synergy Heat Map feature on the i2we platform, described as a visual representation of player performance across all synergy stages.
Feature areas
Want this for your program?
Related demos
Browse all →
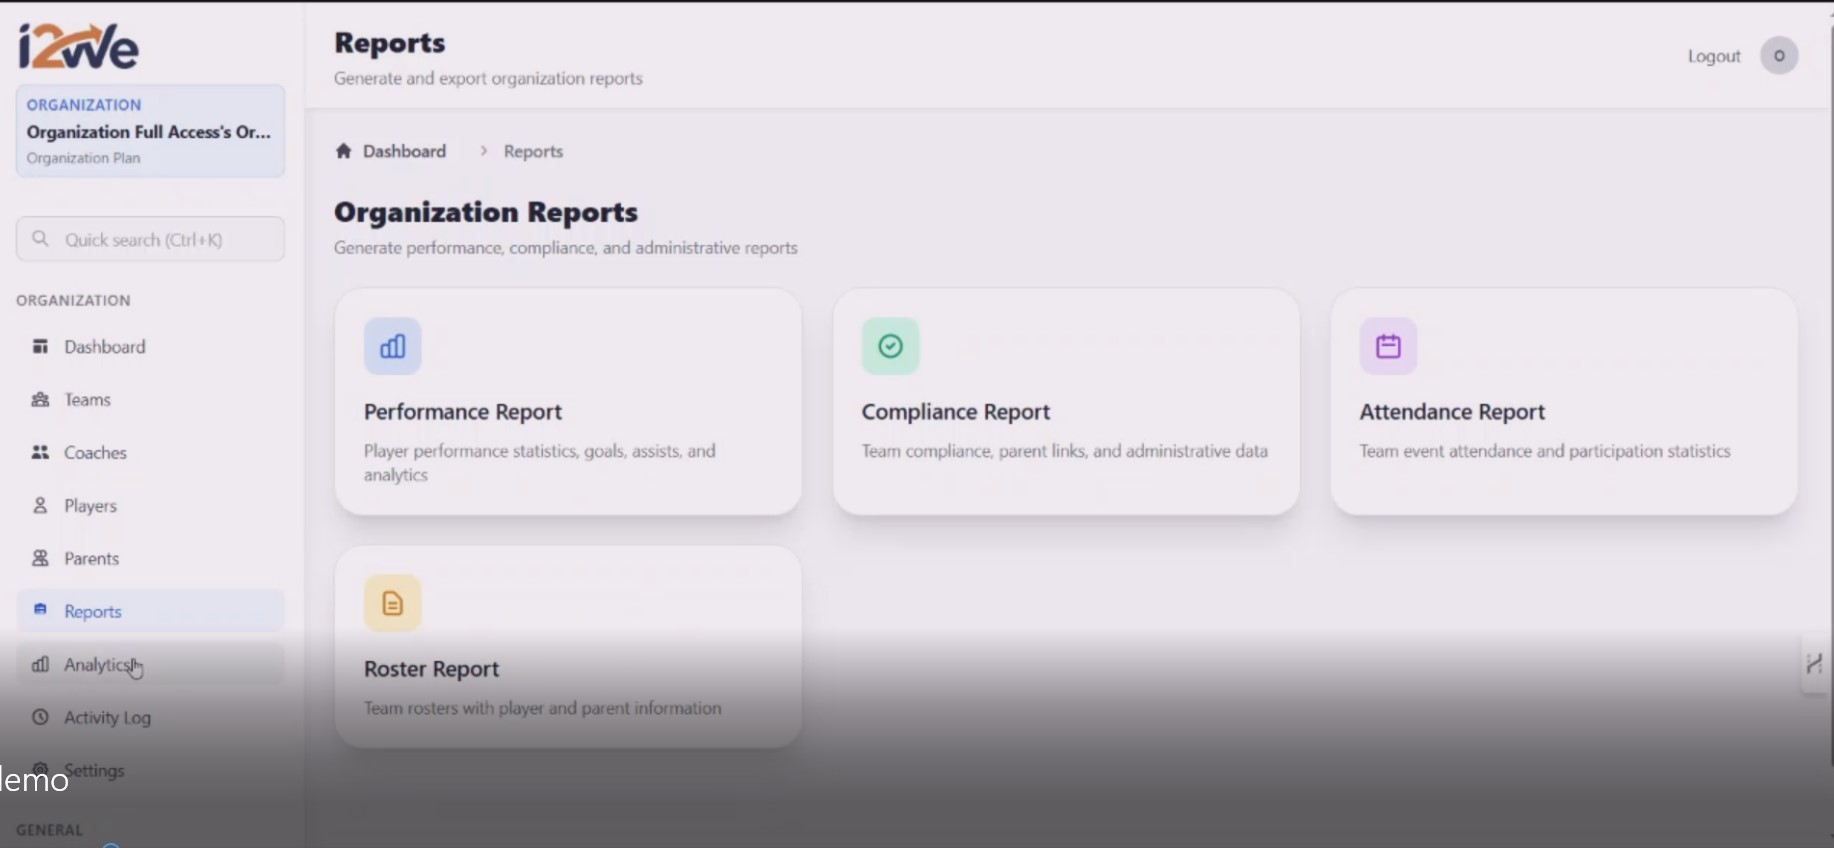
Orgnization Demo
Short blurb shown on the demo card
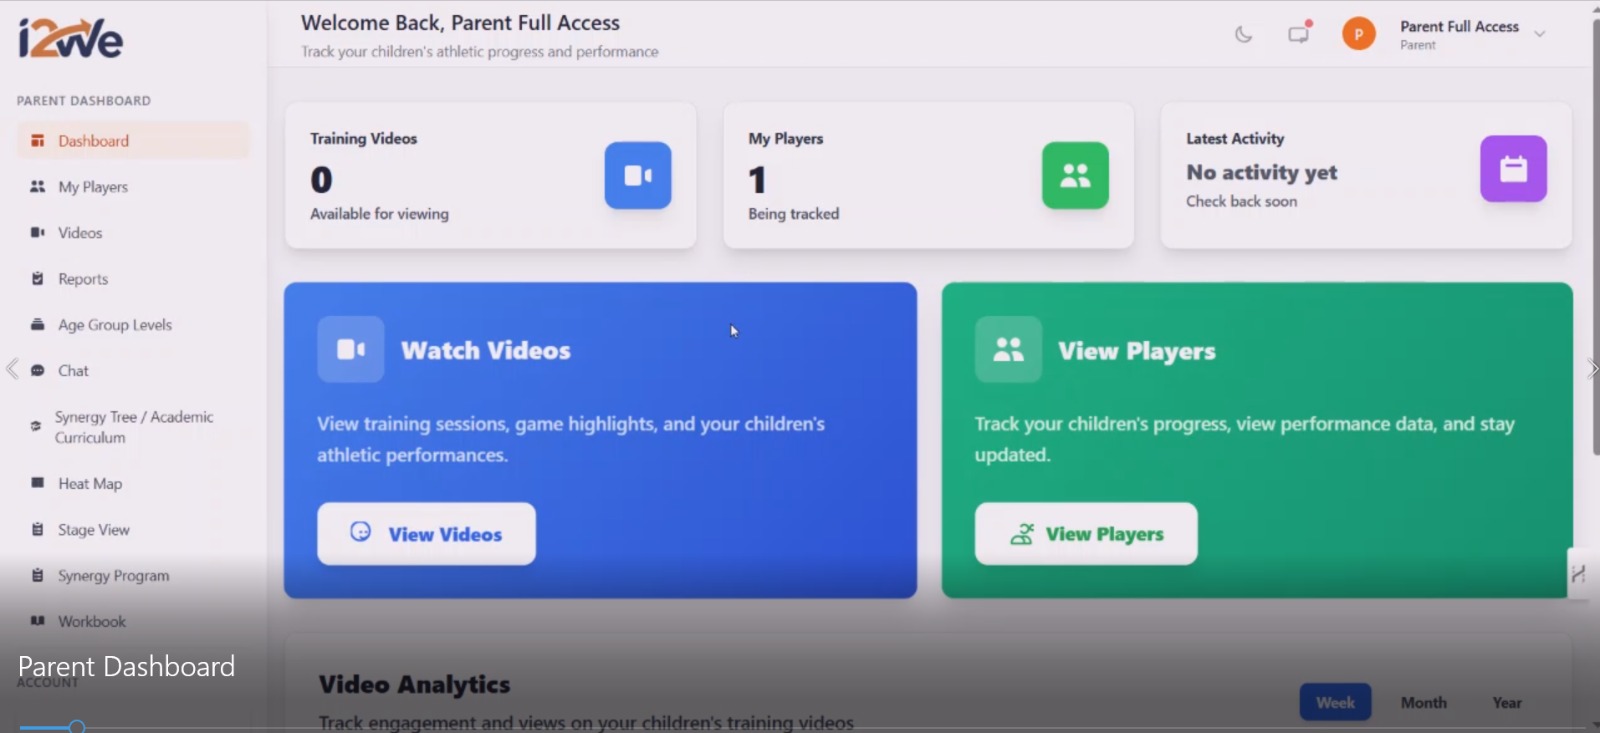
Parent Demo
This is a screen recording / demo tour of a Parent Dashboard for a platform called i2we — an athletic training and player development platform for children.
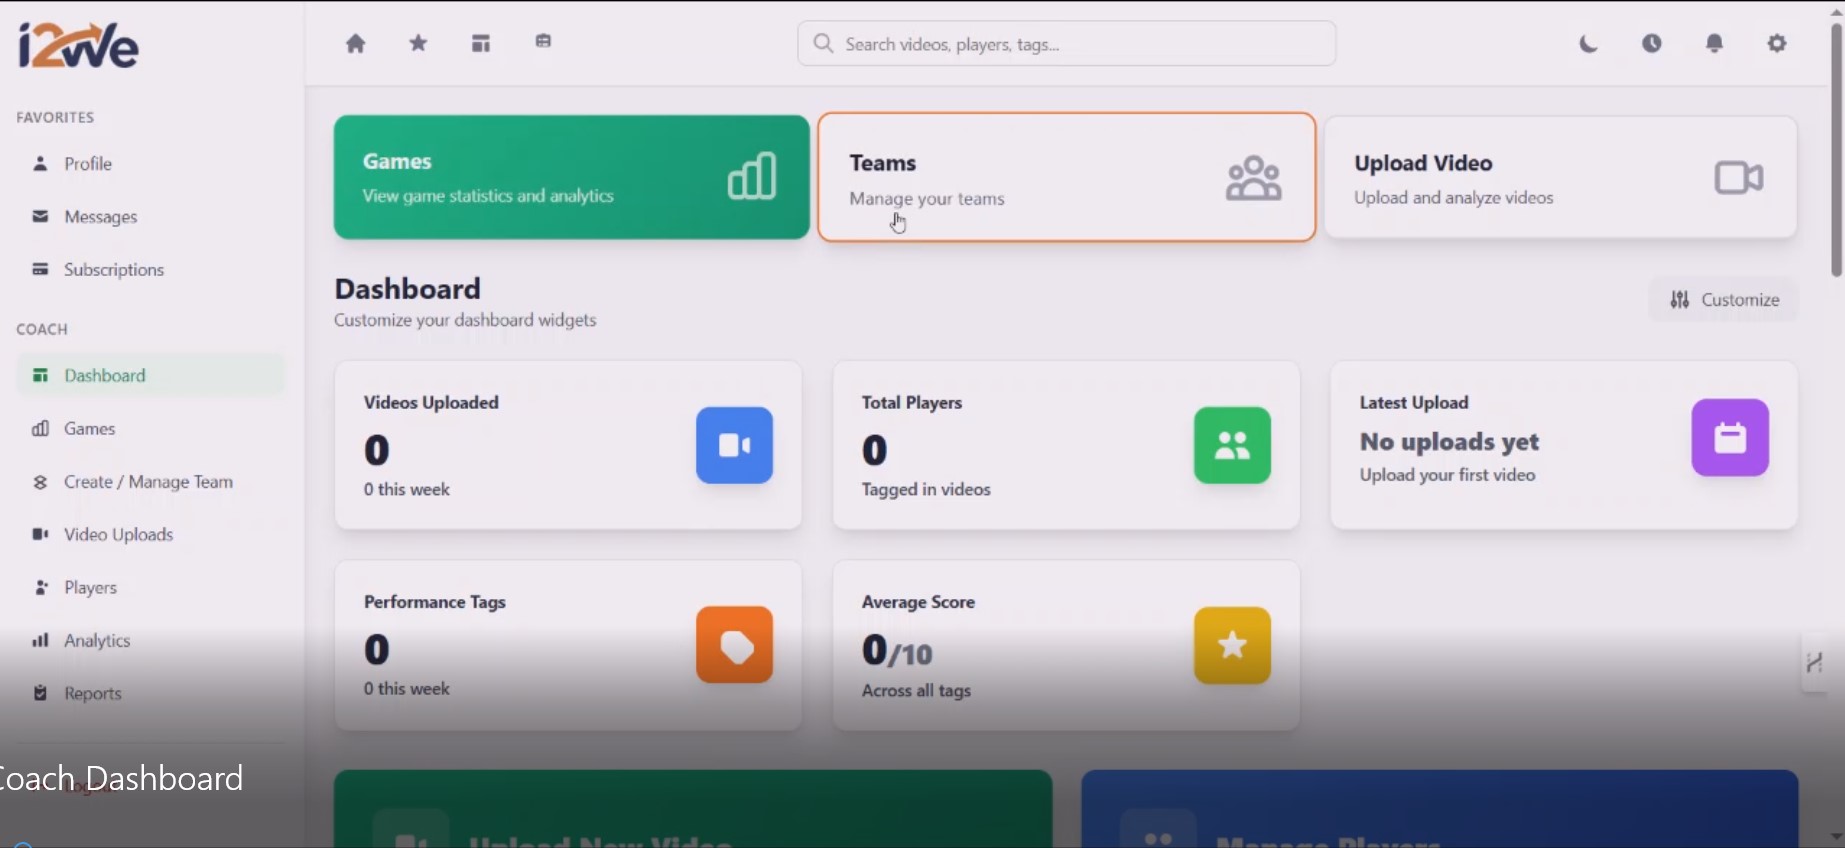
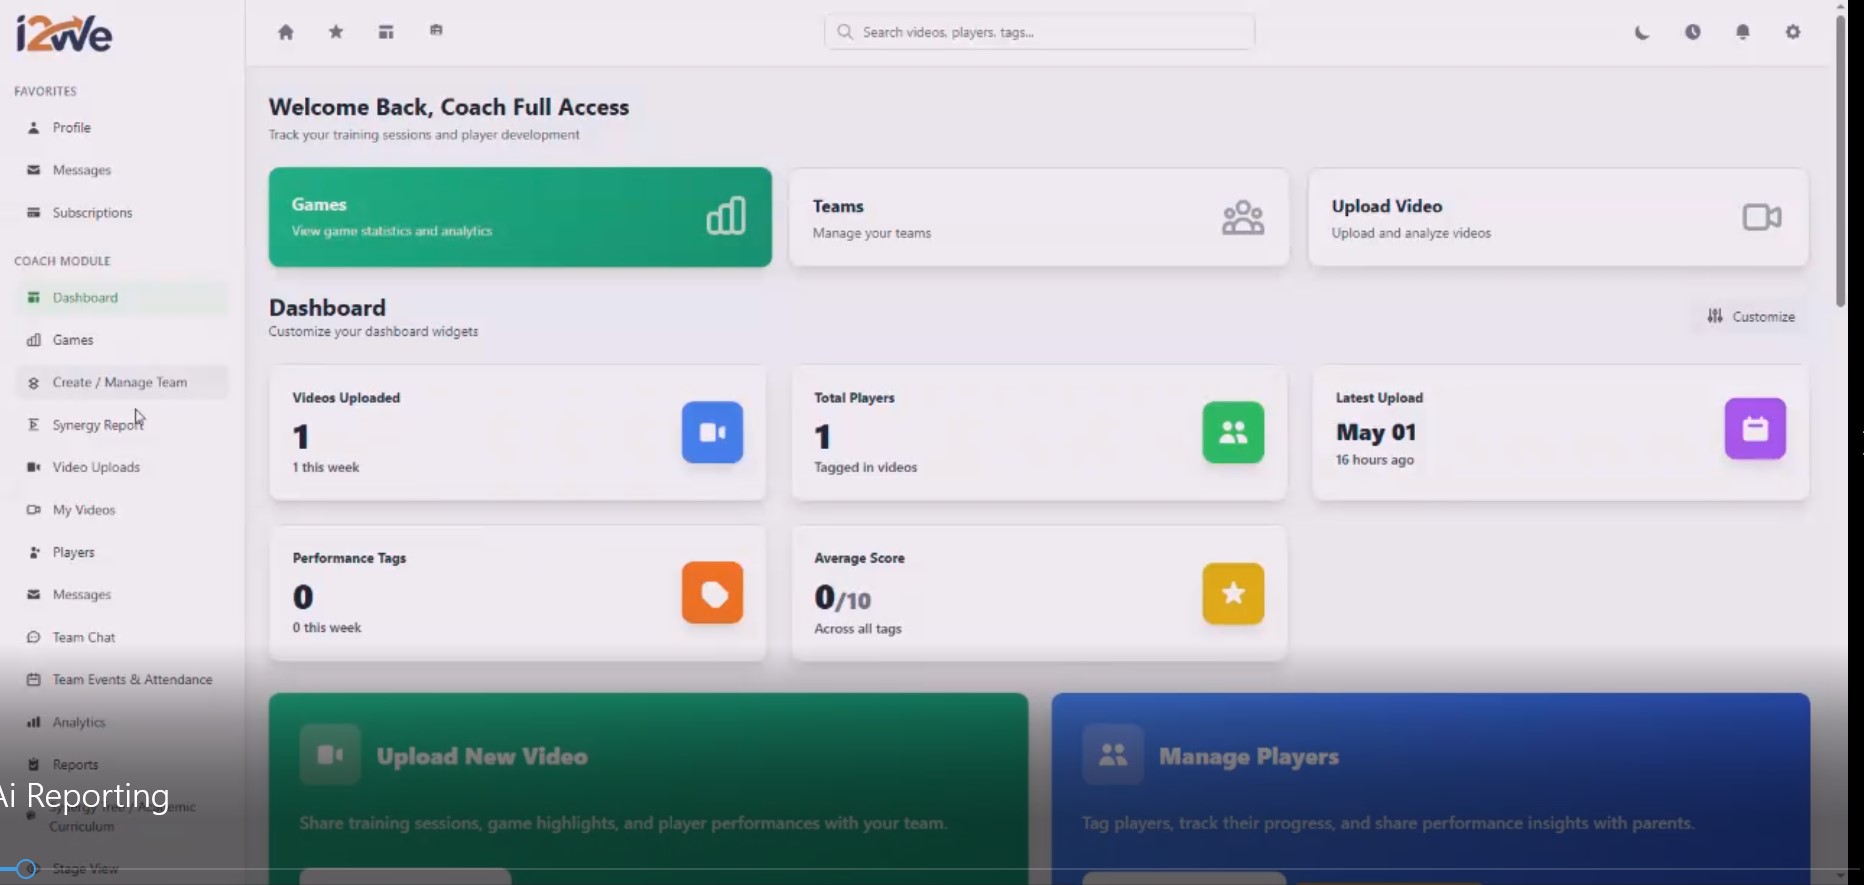
Coach Dashboard Demo
This is a screen recording walkthrough of the Coach Dashboard on the i2we platform, which is a sports coaching and player management tool.
Analytics Demo
It opens on the Analytics Dashboard, which shows top-level organization stats
Ai Reporting based on Video upload
Player Management page showing Tyler Pinder's player card, then opens his full profile which includes an AI Match Reports section.
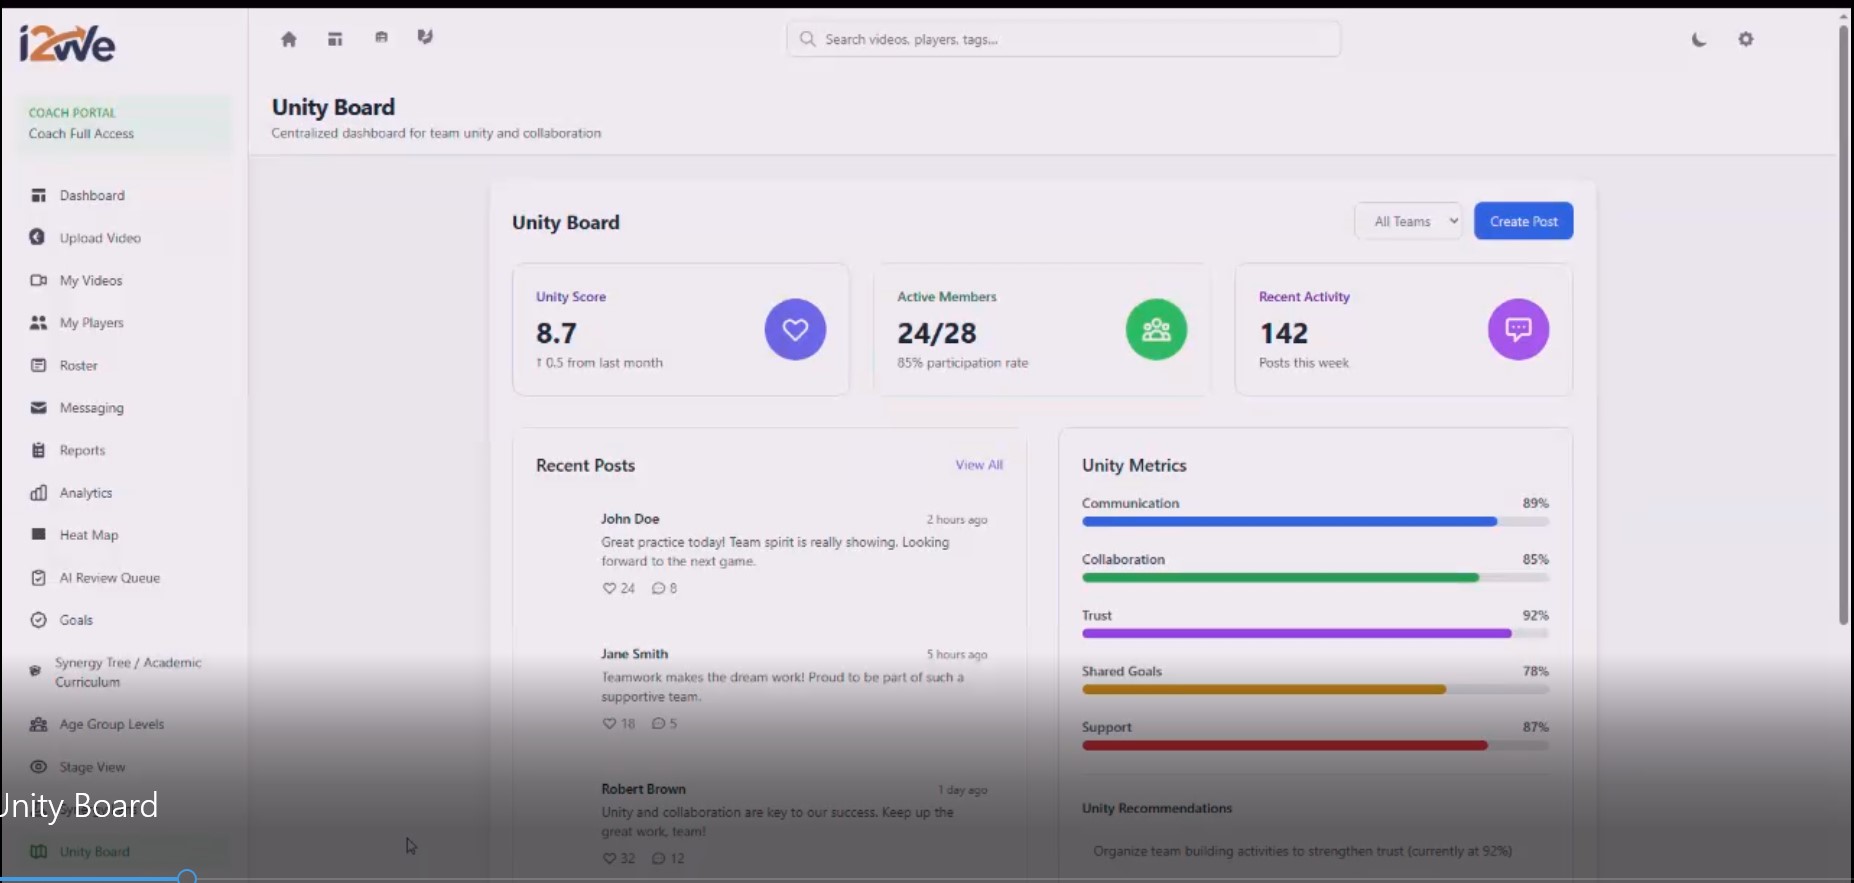
Unity Board
The dashboard displays three top-level stats: a Unity Score of 8.7 (up 0.5 from last month), Active Members at 24 out of 28 with an 85% participation rate, and Recent Activity showing 142 posts this week.